Recently Jeff Goodwin wrote a piece over at the Noble Research Institute detailing 8 grazing metrics to help you make better grazing decisions. At PastureMap we know logging and tracking all the details for your ranch can be difficult, which is why we designed our system to do the heavy lifting for you. In order to best prepare our users for the upcoming season, we prepared a guide to show you how you can track all 8 key metrics detailed by Jeff within the PastureMap system. If you are new to PastureMap, you can follow along in our free trial here.
Stocking Rate
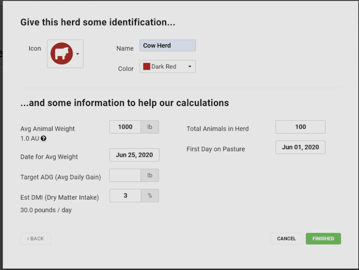
PastureMap automatically calculates your specific stocking rate after you import your animals and pastures into the system. You can add animals and pastures manually or upload an excel file using the PastureMap template. Once added to the system you can set your herd weights in order for PastureMap to auto-calculate your animal demand units.
Carrying Capacity, Animal Demand and Animal Units
Recording a pasture inventory is quick and easy in PastureMap. Actually estimating the available forage per acre to capture carrying capacity per pastures might seem a little more complicated. Jeff covered the calculations really well, so we aren’t going to go into much detail. If you want additional information check out our blog here for four ways to estimate available forage inventory, ranging from a quick estimate to an exact measurement.
Once you have estimated pasture inventory, calculate total carrying capacity in each pasture.
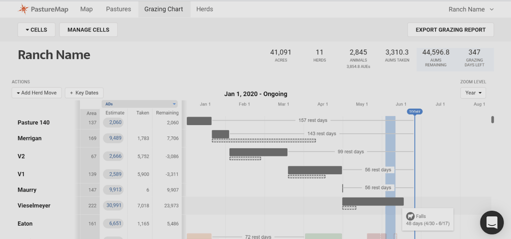
Your carrying capacity is the total ADs in each pasture.
Animal Days / Acre (ADAs) X pasture size (acres) = Animal Days (ADs) If you need help estimating pasture acreage, PastureMap helps you draw your pastures to estimate acres.
Allowable Forage and Harvest Efficiency
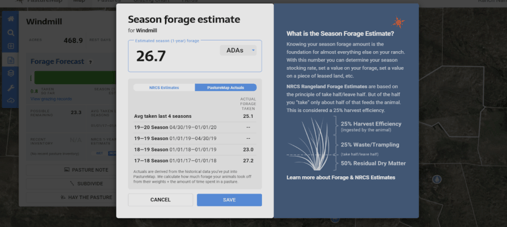
Your allowable forage is automatically calculated via our Forage Forecasting tool. We pull in the data you have inside PastureMap to generate your estimated forage consumption and grazing days. We also include the NRCS 1 year estimates to provide a quick reference check.
Grazeable Acres
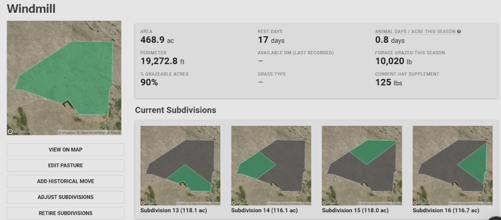
PastureMap allows you to calculate Grazeable Acres in two ways. You can click into each of your pastures and manually set the % of acres that are grazeable, so if you know 10% of your land is a body of water, you just set your grazeable acres to 90%. You can also flag areas with our mapping tool by adding a subdivision and tagging it as not grazeable.
Stock Density, Grazeable Days Per Pasture, Stock Days Per Acre
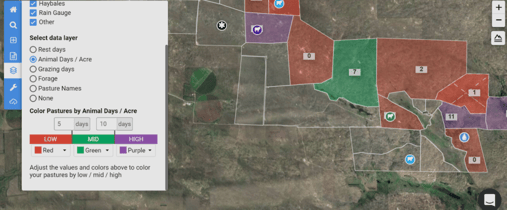
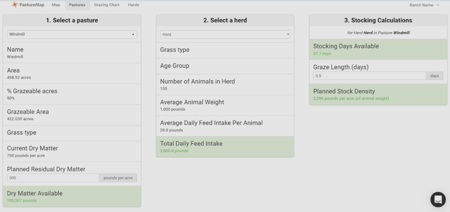
For a deep dive into how to calculate these metrics refer to Jeff’s original post and check out our blog. PastureMap helps you work through these calculations with our stocking calculators and by providing you with color-coded data layers for all of your pastures once they are drawn in the system.
Grazeable Days Per Pasture = (Available ADA’s x Pasture area) / Herd Daily Dry Matter Demand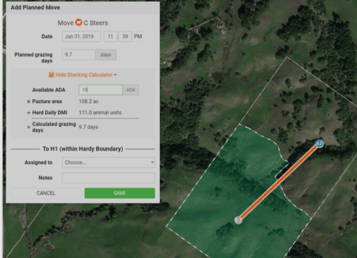
Stocking density is the number of animals you can run in an area, for a specific period of time. You can plug these numbers into our stocking calculator and it will show you a planned live weight per acre.
With all the stress and work that comes along with managing a successful grazing system, we believe helping you manage your metrics successfully is the least we can do.
Interested in learning what else PastureMap can do to simplify your grazing management?
Signup for a free trial today!